Documentation
This document provides technical details about the BSLVC Dashboard and all available functions.
User Interface
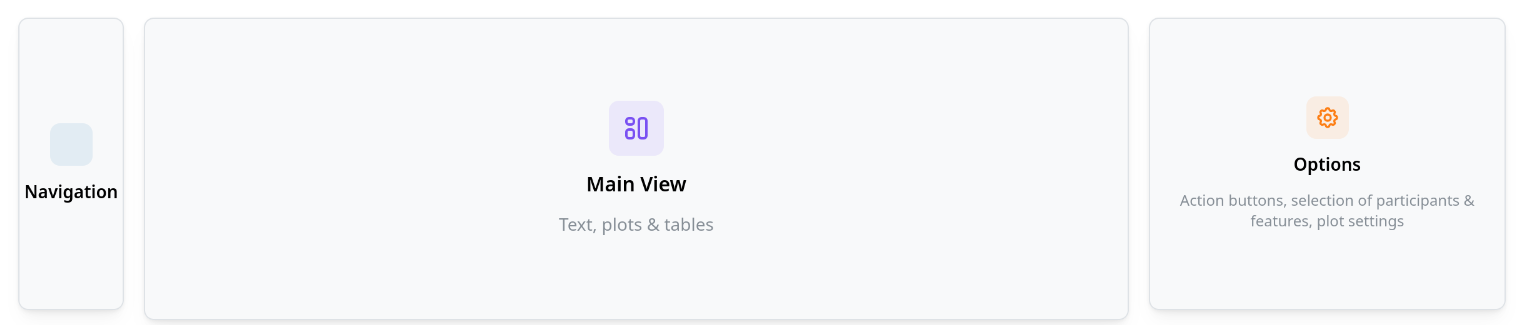
The user interface of the BSLVC Dashboard is structure into two or three parts, depending on the page: - The navigation bar at the left side. - The main window in the middle. - The options panel in the data analysis modules.
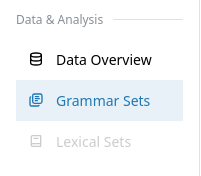
The heart of the dashboard are the analysis modules for the grammar and the lexical data. These can be found in the section "Data & Analysis" in the navigation bar. Currently, only the grammar analysis module is finished. In what follows, you will find a description of all available options in the Dashboard.
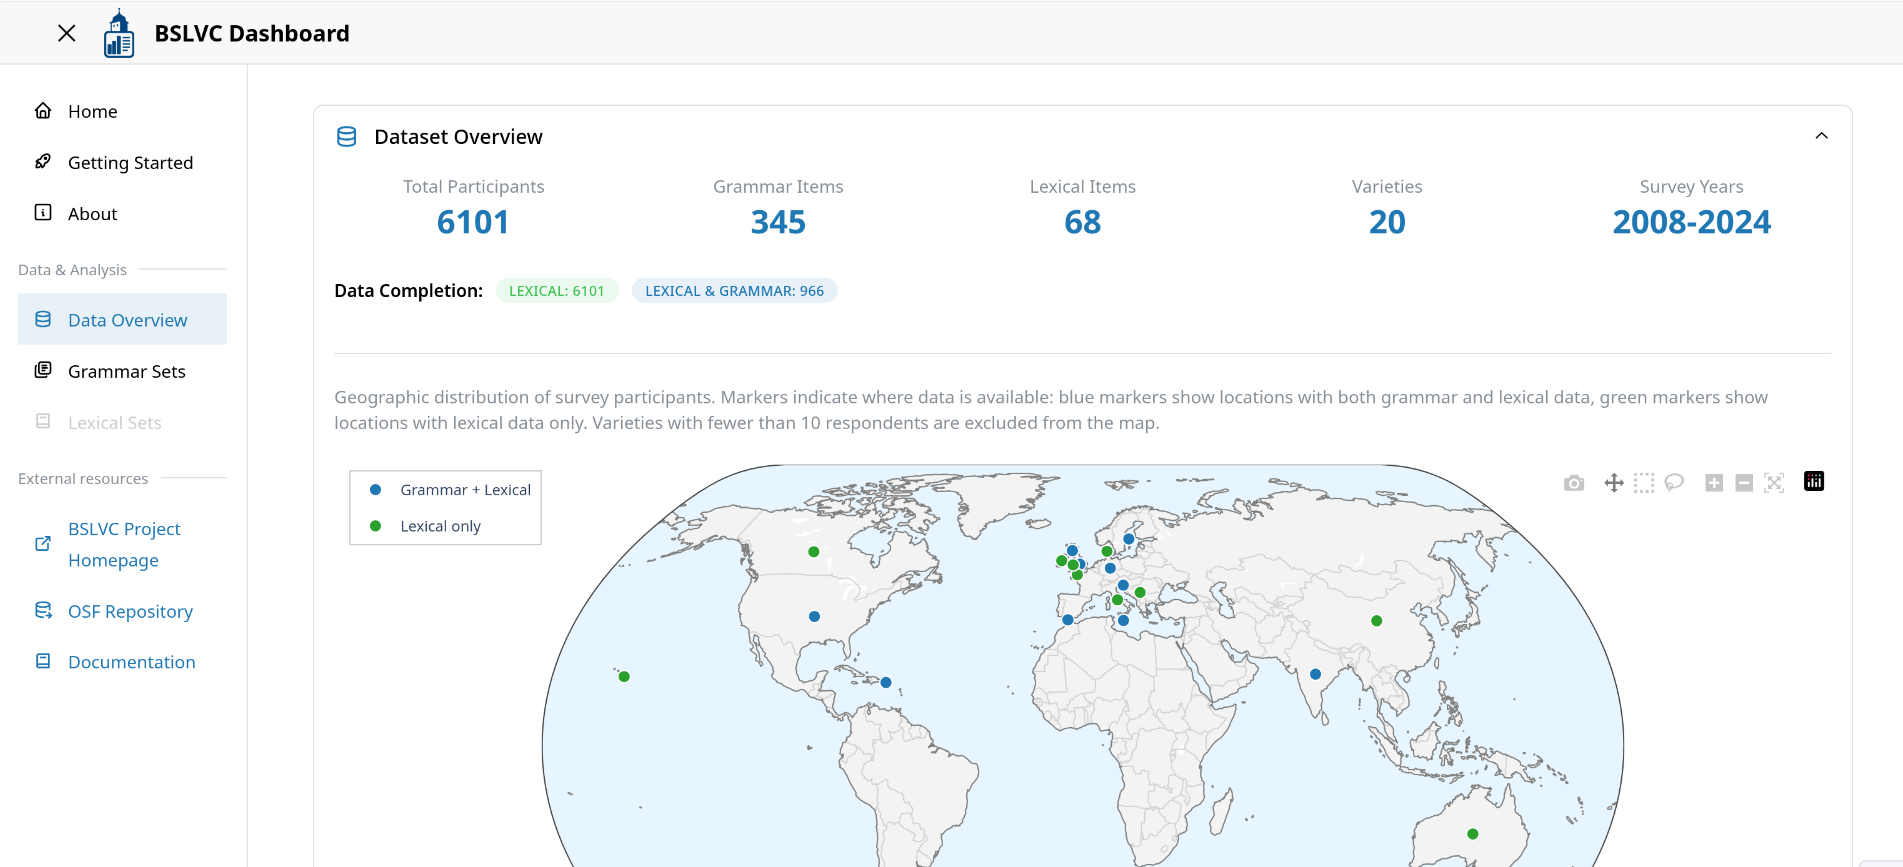
Data Overview
The Data Overview page provides statistical summaries and visualizations of the BSLVC dataset, including participant demographics, geographical distribution, the grammatical items, and data completeness metrics.
Grammar Analysis Module
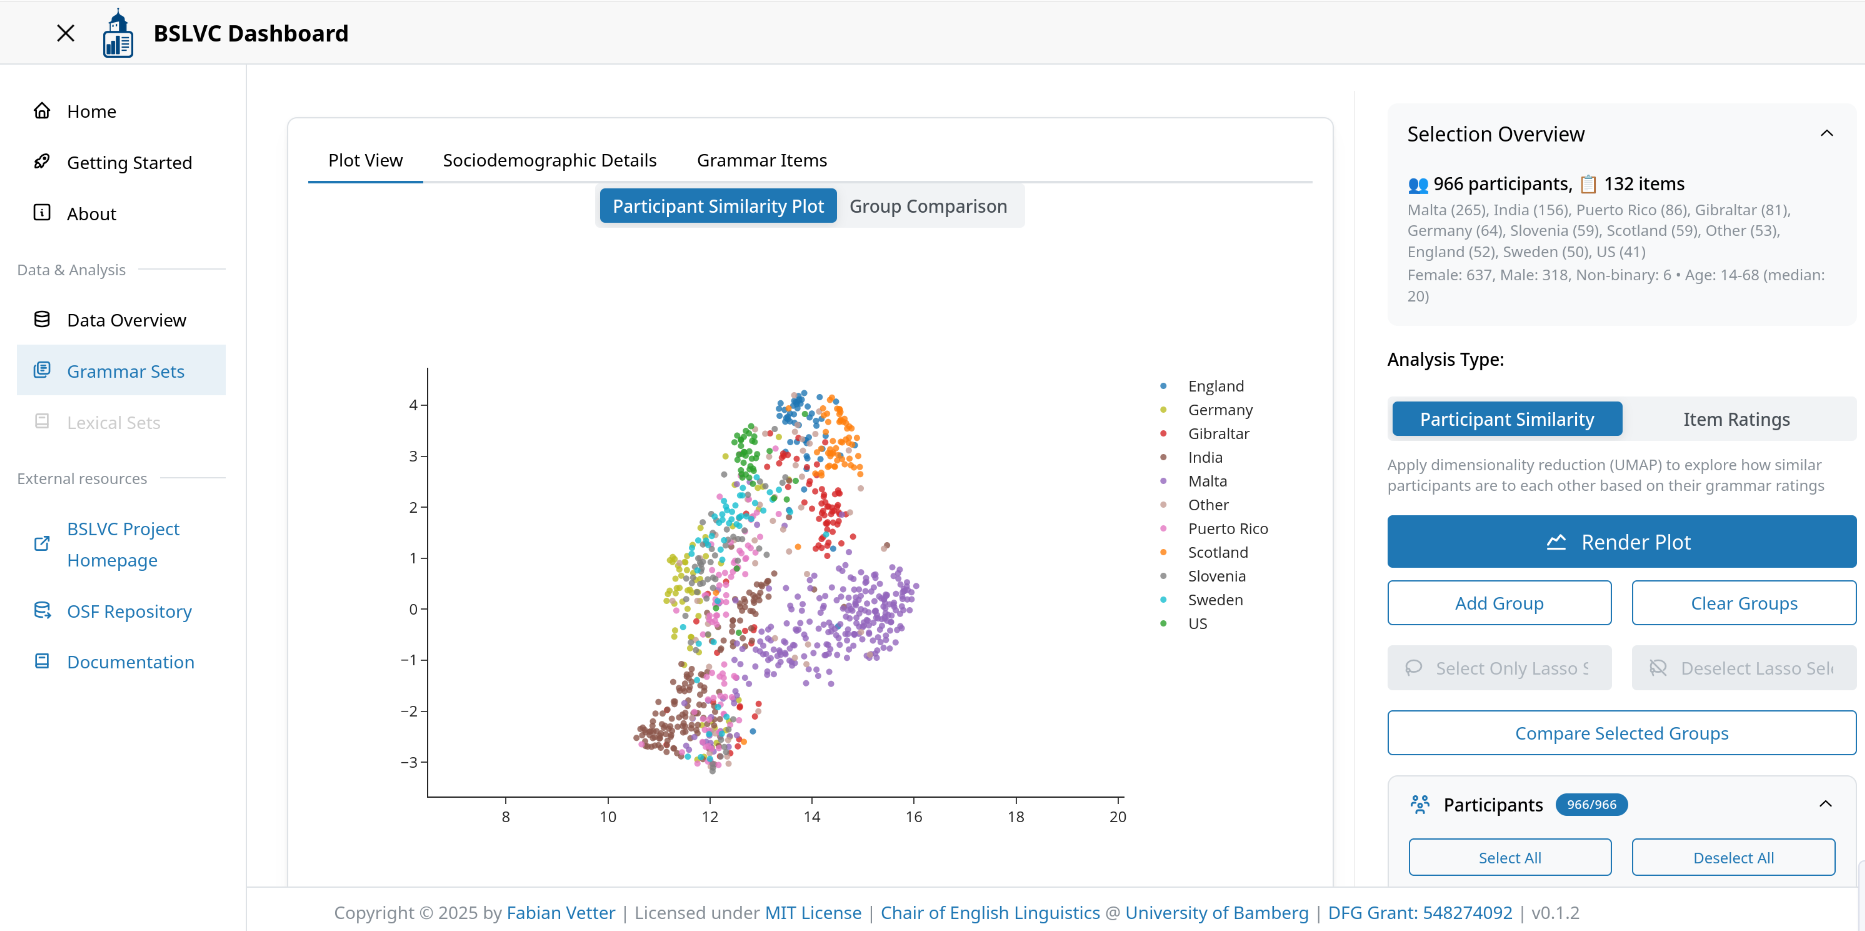
The Grammar Analysis Module allows users to explore grammatical variation across different varieties of English through interactive visualizations and statistical analyses. You can access it by clicking "Grammar Sets" in the navigation.
Available Functions
Below is a description of all major buttons and UI elements in the Grammar Analysis module:
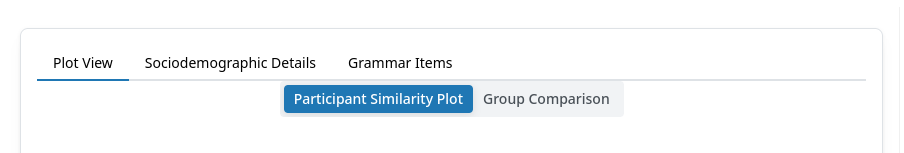
Main Tabs
The main content in the middle of the dashboard contains multiple tabs.
- Plot View: Shows either the dimensionality reduction plot and the group comparison plot, or item ratings plot. Note: The group comparison plot uses the same settings that were used for the dimensionality reduction. Any changes that have been applied to the settings in the UI are not taken into account. This is to ensure that the group comparison is linked to the dimensionality reduction plot.
- Sociodemographic Details: Displays participant information and summary plots. These plots update automatically upon changing settings in the UI.
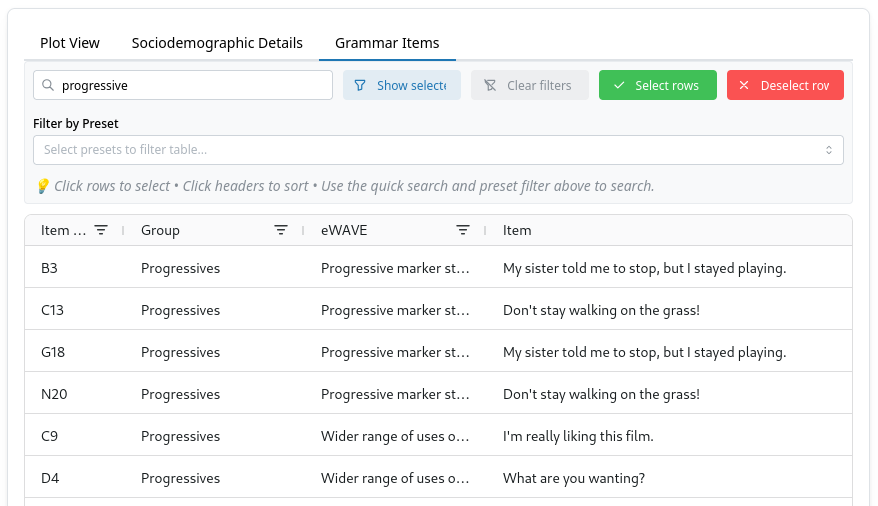
- Grammar Items: Shows a table of all grammar items and metadata. This table supports dynamic filtering, and can also be used for modifying the selected items in the grammar items tree.
Interactive Plot Controls
All plots in the dashboard are created using Plotly, which provides interactive controls for exploring and manipulating visualizations. These controls appear in a toolbar when you hover over any plot.
Available Controls:
- Download plot as SVG: Save the current view of the plot as a vector image
- Zoom: Click and drag to zoom into a specific region of the plot
- Pan: Move the plot around after zooming (shift + click and drag, or use the pan tool)
- Box Select: Click and drag to select multiple data points in a rectangular region
- Lasso Select: Draw a freeform selection around data points (used for custom group comparison)
- Zoom In/Out: Incremental zoom controls
- Autoscale: Reset the plot to its original view and scale
- Reset axes: Return to the default axis ranges
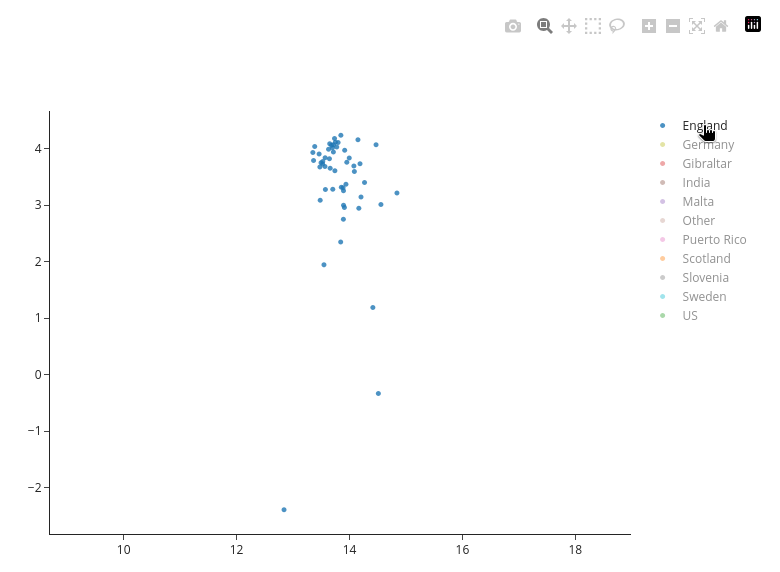
- Show/Hide Legend Items: Click on legend entries to hide/show specific varieties or groups
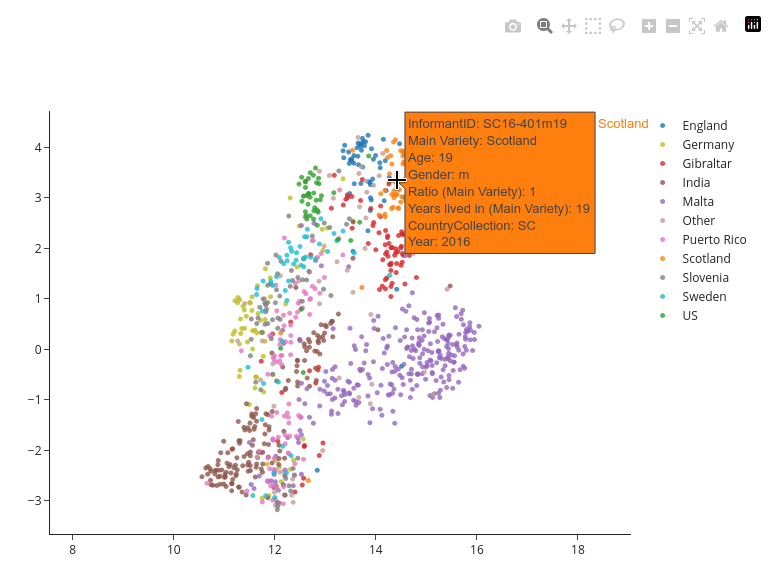
Hover Information:
Hovering over data points in plots displays an overlay with additional information such as the participant ID, variety, gender, age, etc.
Tips:
- Double-click on the plot to reset zoom and pan
- Click legend items once to hide/show them; double-click to isolate a single item
- Use the box or lasso select tools in combination with the UMAP group buttons for custom analyses
- The download function captures the current state of the plot, including any zoom or pan adjustments
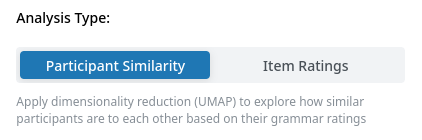
Analysis Type Selector
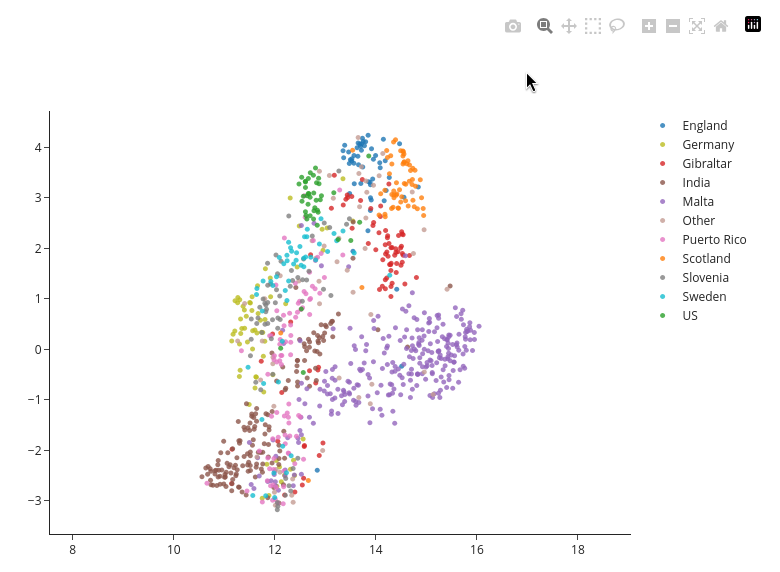
This switch controls the analysis mode. Users can choose between "Participant Similarity" and "Item Ratings" plots.
In the mode "Participant Similarity", the dashboard applies dimensionality reduction to the selected data using Uniform Manifold Approximation and Projection (UMAP; https://umap-learn.readthedocs.io/en/latest/). Additionally, users can compare groups in the plot. This can be done either by selectively hiding varieties, or by using the lasso tool to create custom groups. For detailed instructions, see the instructions for custom group comparison.
In the mode "Item Ratings", users can compare the ratings of specific features. This mode is best suited for the comparison of a relatively small number of features. Some plot modes have limits of how much items and varieties can be displayed. Should you hit such a limit, the dashboard issues a warning notification.
Render Plot
This button generates the plot based on the user input.
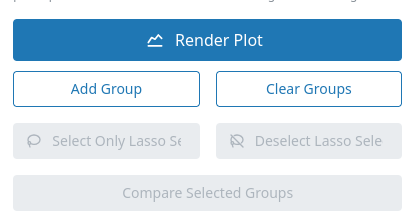
UMAP Group Buttons (visible in "Participant Similarity" mode)
These buttons facilitate custom group comparisons or excluding outliers from the selection. They all require a lasso selection of data points via the lasso tool in the mode bar at the top of the participant similarity plot as input.
The "Add Group" and "Clear Group" buttons override the default variety-based grouping of the "Compare Selected Groups" function. More detailed instructions can ben found in the section custom group comparison.
The "Deselect Lasso Selection" and "Select Only Lasso Selection" buttons modify the selection in the participants tree. These functions are helpful for deselecting outliers visible in the dimensionality reduction.
- Add Group: Add a group of participants for comparison.
- Clear Groups: Remove all defined groups.
- Select Only Lasso Selection: Select only participants currently selected via lasso tool.
- Deselect Lasso Selection: Deselect participants selected via lasso tool.
- Compare Selected Groups: Run a statistical group comparison. The ordering method can be switched between Kruskal-Wallis ε² (default) and Random Forest using the segmented control above this button. The group comparison view provides a toggle between Plot and Table view. The plot view shows a horizontal bar chart of feature importances with per-group mean ratings and confidence intervals. The table view contains three tabs:
- Performance: Describes the method used. For Kruskal-Wallis ε² this tab explains the effect size measure; for Random Forest it shows OOB accuracy and error rate, number of trees, classes, features, and samples.
- Confusion Matrix (OOB Predictions): Available for Random Forest only. An interactive table with colour-coded cells (green for diagonal/correct, red-scaled for off-diagonal/misclassifications). Downloadable as CSV.
- Top Items: An interactive table listing all ranked features with their item code, feature description, eWAVE label, feature group, sentence, effect size or Gini importance, and per-group mean ratings. Downloadable as CSV.
- A data source badge indicates whether imputed or raw data were used.
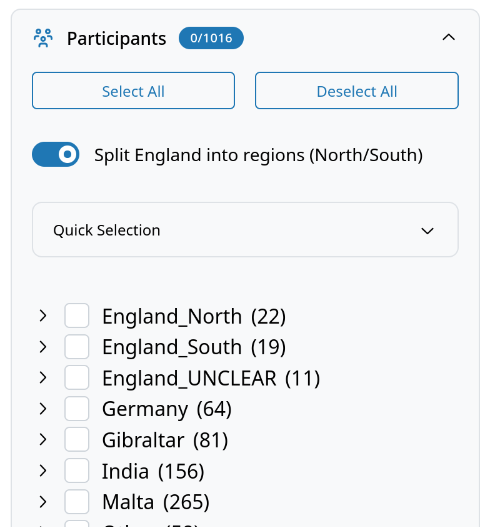
Participant Selection
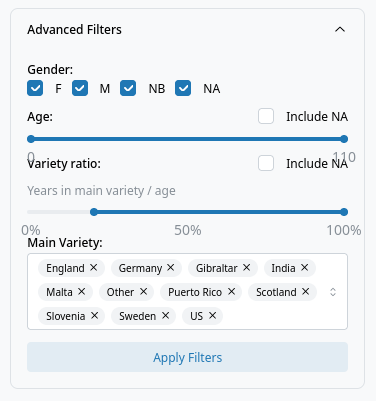
Participants can be selected via the participant tree, either by clicking the checkboxes in the tree, by using presets or by using the buttons. Additionally, users can use the "Advanced Filters" section to select participants based on their sociodemographic details.
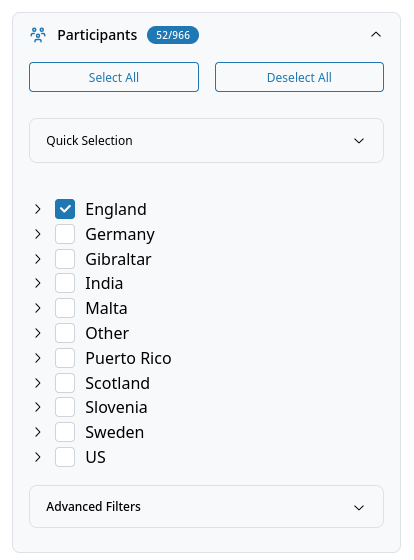
- Select All: Select all participants in the tree.
- Deselect All: Deselect all participants.
-
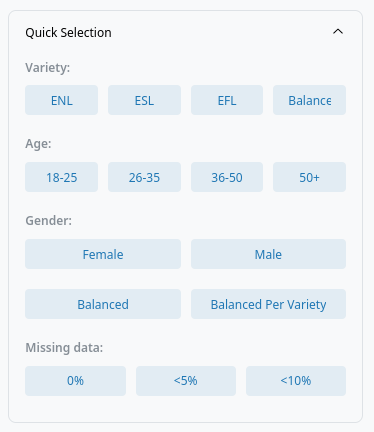
Quick Selection: Batch select by variety, age, gender, completeness, or balanced groups. Available presets for common selections:
- ENL: Select all L1 varieties (England, Scotland, US)
- ESL: Select all L2 varieties (Gibraltar, India, Malta, Puerto Rico)
- EFL: Select all EFL varieties (Germany, Slovenia, Sweden)
- Balanced: Select a balanced sample across all varieties
- Age Groups: Select participants from specific age groups
- Gender:
- Female: Select all female participants
- Male: Select all male participants
- Balanced: Select a gender-balanced sample across all varieties
- Balanced per Variety: Select a gender-balanced sample within each variety
- Missing values: Select participants with 0%, <5% or <10% of missing values
- Advanced Filters: Filter participants by gender, age, variety ratio, and main variety.
- Apply Filters: Apply selected participant filters. This overrides the current selection in the participant tree.
Advanced Regional Mapping
The switch "Advanced regional mapping" applies a custom variety mapping to participants based on the advanced_regional_mapping.csv file. For each participant listed in that file, their MainVariety is replaced with the value specified in the CSV. Participants not listed in the file keep their original MainVariety unchanged. This allows fine-grained regional splits beyond the standard variety categories (e.g. splitting England into sub-regional varieties).
AI-Generated Participants
The switch "Include AI-generated participants" adds LLM-generated participants to the dataset. These participants were created by Deckert, Katharina and Fabian Vetter (in preparation), who prompted large language models to act as speakers of different varieties of English and fill in the BSLVC questionnaire. The goal of this extension is to investigate how varieties of English are encoded in modern LLMs. AI-generated participants are displayed using toned-down pastel colors and are prefixed with "AI-GPT-" in the legend and hover information.
Grammar Item Selection
All grammar items can be selected in the grammar items tree. They are first grouped by mode, then by feature group. Items can be either selected by clicking the checkboxes, by using presets or the buttons above the tree, or via the grammar items table in the main view. The getting started section in the app describes how the grammar items table can be used for custom item selections.
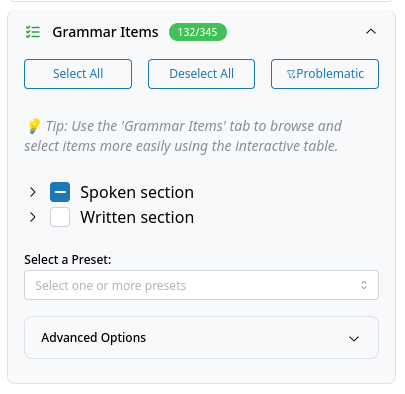
- Select All: Select all grammar items.
- Deselect All: Deselect all grammar items.
- Flagged: Deselect flagged items. See flagged items for more information. Currently the following items are flagged: 'M19', 'J23', 'C21', 'C14' and 'A4' for use of currency; 'E22', 'D12' and 'E6' for different renderings of the item in some varieties.
- Select a Preset: Multi-select dropdown for item presets (mode, feature groups, eWAVE feature groups).
-
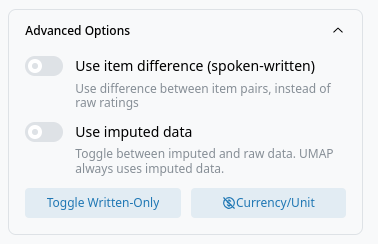
Advanced Options:
- Use item difference (spoken-written): Toggle to use difference between item pairs. Most items feature in the spoken and the written section of the BSLVC. These features are referred to as twin items. If this switch is set to true, the interface calculates the difference of the ratings for twin items (spoken - written) for each participant and uses this value for all subsequent plots. Naturally, items that feature only in the written section are excluded.
- Use imputed data: Toggle between imputed and raw data. The dimensionality reduction always uses the imputed data, as UMAP cannot handle missing values. See Data Imputation for details on how the imputation is performed.
- Toggle Written-Only: Toggle items which feature only in the written section.
- Currency/Unit: Toggle currency/unit items.
UMAP Settings
The UMAP Settings allow the user to tweak the UMAP hyperparameters, as well as the distance metric used, whether to standardize the participant ratings and the coloring.
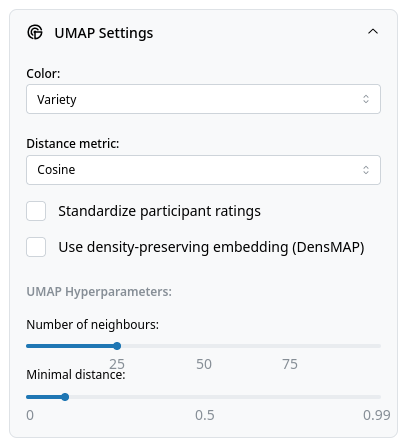
- Color: Select coloring variable (Variety, Variety type, Gender). This setting does not trigger a rerender of the plot and can be changed after rendering the plot.
- Distance metric: Choose metric (Cosine, Euclidean, Manhattan).
- Standardize participant ratings: Checkbox to standardize ratings. Standardization is advised for use with Euclidean and Manhattan distances.
- Use density-preserving embedding (DensMAP): Checkbox for DensMAP (https://umap-learn.readthedocs.io/en/latest/densmap_demo.html). By default, UMAP does not preserve densities of clusters well. DensMAP tries to preserve the density of clusters when reducing dimensionality. Compatible with both 2D and 3D modes.
- 3D UMAP (experimental): Renders the embedding in three dimensions. Lasso selection is not available in 3D mode.
- Show KDE density contours: Checkbox to overlay 2D kernel density estimation (KDE) contours on the UMAP plot. When enabled, filled contour regions are drawn behind the scatter points for each variety, visualizing the density distribution of participants in the embedding space. Contour visibility is linked to the legend: hiding a variety via the legend also hides its contours. This option can be toggled at any time without re-rendering the plot. Not available in 3D mode.
- Number of neighbours: Slider for UMAP hyperparameter. Check the UMAP docs for more info.
- Minimal distance: Slider for UMAP hyperparameter. Check the UMAP docs for more info.
UMAP Quality Metrics
After each UMAP render, three quality metrics are displayed below the plot. All values are between 0 and 1; higher is better. The metrics are computed using k = n_neighbours (the same value used for the UMAP embedding).
- Trustworthiness: Measures how many of each point's k nearest neighbours in the low-dimensional plot were also close in the original high-dimensional space. A low value indicates that the plot introduces false closeness — points that appear nearby were not actually similar. Values above ~0.85 are generally good for this type of data.
- Continuity: The complement of trustworthiness: measures how many true high-dimensional neighbours remain close in the plot. A low value indicates that genuinely similar participants have been pulled apart in the embedding. Values above ~0.88 are generally good.
Item Plot Settings
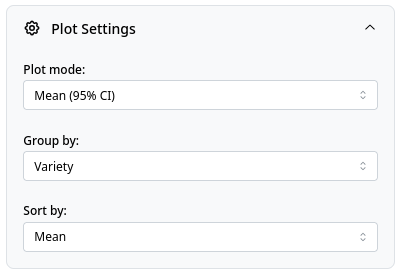
-
Plot mode: Select plot type for visualizing grammar items:
- Mean (95% CI): Plot mean values of features with confidence intervals
- Mean (95% CI - split varieties): Plot mean values of features with confidence intervals. Each variety is represented separately on the y-axis. This helps to avoid overplotting, but also limits how many features and items can be displayed.
- Diverging stacked bars: Show the distribution of ratings for each feature in a diverging stacked barchart.
- Informant mean of selected features (boxplot): Calculates a mean rating across all selected features for each participant and displays the distribution of these means in a boxplot.
- Correlation matrix: Displays a correlation matrix showing the pairwise correlations between the selected features.
- Missing values heatmap: Displays a heatmap indicating the presence of missing values across the selected features.
- Twin correlation: Displays the spearman rank correlation for twin items per group. Only available if "Use item difference (spoken-written)" is enabled.
-
Group by: Select grouping variable (Variety, Variety type, Gender).
- Sort by: Sort items by mean, standard deviation, or alphabetically.
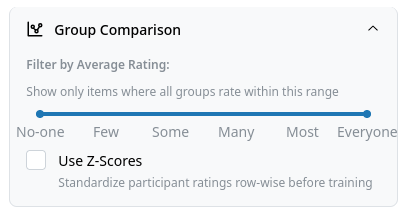
Group Comparison Settings
This is only available if mode is set to "Participant Similarity". These functions can be used to filter out items that fall outside a certain rating range, or to apply standardization of the ratings before training the Random Forest.
- Ordering method: Segmented control to select the variable ranking method:
- Kruskal-Wallis ε² (default): Ranks items by the Kruskal-Wallis effect size ε² = H / (n − 1), where H is the Kruskal-Wallis test statistic and n is the total sample size. ε² ranges from 0 (no difference between groups) to 1 (all variance explained by group membership). This is a non-parametric rank-based test that makes no assumptions about the distribution of ratings and tests each item independently.
- Random Forest: Trains a Random Forest classifier (500 trees, balanced class weights) and ranks items by their mean decrease in Gini impurity. Provides additional outputs: OOB accuracy, confusion matrix, and per-class F1 scores.
- Filter by Average Rating: Range slider to filter items by group average.
- Use Z-Scores: Checkbox to standardize ratings (participant-wise) before training the Random Forest. Only relevant when Random Forest is selected.
Advanced Actions
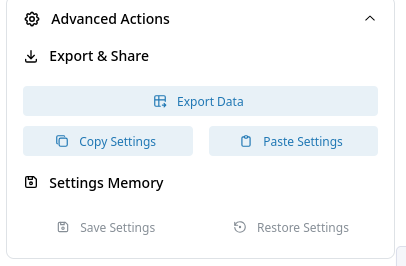
Data Export
The data export section provides multiple options for exporting your selection:
- Export Data: Download current data selection with flexible format options:
- Include sociodemographic data (checked by default): When enabled, includes participant metadata columns (Age, Gender, MainVariety, etc.) in the export. When disabled, exports only InformantID and rating data.
- Include item metadata (unchecked by default): When enabled, transposes the data so items become rows and participants become columns, with item metadata columns (section, feature, group, sentence, etc.) added at the beginning.
- Combined options:
- Neither checked: Minimal export (InformantID + ratings only)
- Only sociodemographic: Standard wide format (participants as rows, items as columns, with participant metadata)
- Only item metadata: Transposed format (items as rows, participants as columns, with item metadata)
- Both checked: Transposed format with participant metadata as header rows
- Export Distance Matrix (visible only in Participant Similarity mode): Downloads a pairwise distance matrix using the same settings as the UMAP plot (distance metric, standardization, selected participants and items). Participant IDs are used as both row and column labels.
- Download Aggregated Item Data (visible only in Item Ratings mode): Downloads aggregated statistics for the currently displayed item plot as a ZIP archive containing:
aggregated_data.csv: Mean ratings, confidence intervals, standard deviations, medians, missing value counts, and participant counts for each item-group combinationparticipant_group_mapping.csv: Mapping of participant IDs to their assigned groupssociodemographic_summary.csv: Sociodemographic summary statistics (mean age, gender distribution, etc.) for each grouplog.txt: Export metadata including timestamp, selections, and settings used
Settings
- Copy Settings: Copy current settings to clipboard. This function converts the current settings into a base64 code and copies it to the clipboard. This code can be used to share settings with other users or save the settings in a text file for later use.
- Paste Settings: Paste settings from clipboard. This button takes the base64 code created with the "Copy Settings" function to restore settings.
- Save Settings: Save current settings locally. Helpful for temporarily saving the settings.
- Restore Settings: Restore previously saved settings with the "Save Settings" function.
Custom Group Comparison
Custom group comparison allows you to compare groups of participants beyond the default variety-based grouping. This is particularly useful for analyzing subgroups or excluding outliers. You should select at least two groups. Newly added groups will be indicated with symbols. Data points that are hidden by clicking on the variety names in the plot legend will not be taken into account when groups are compared.
How to create custom groups:
- Render a UMAP plot with your desired participants and settings
- Use the lasso tool in the plot's mode bar to select a group of participants
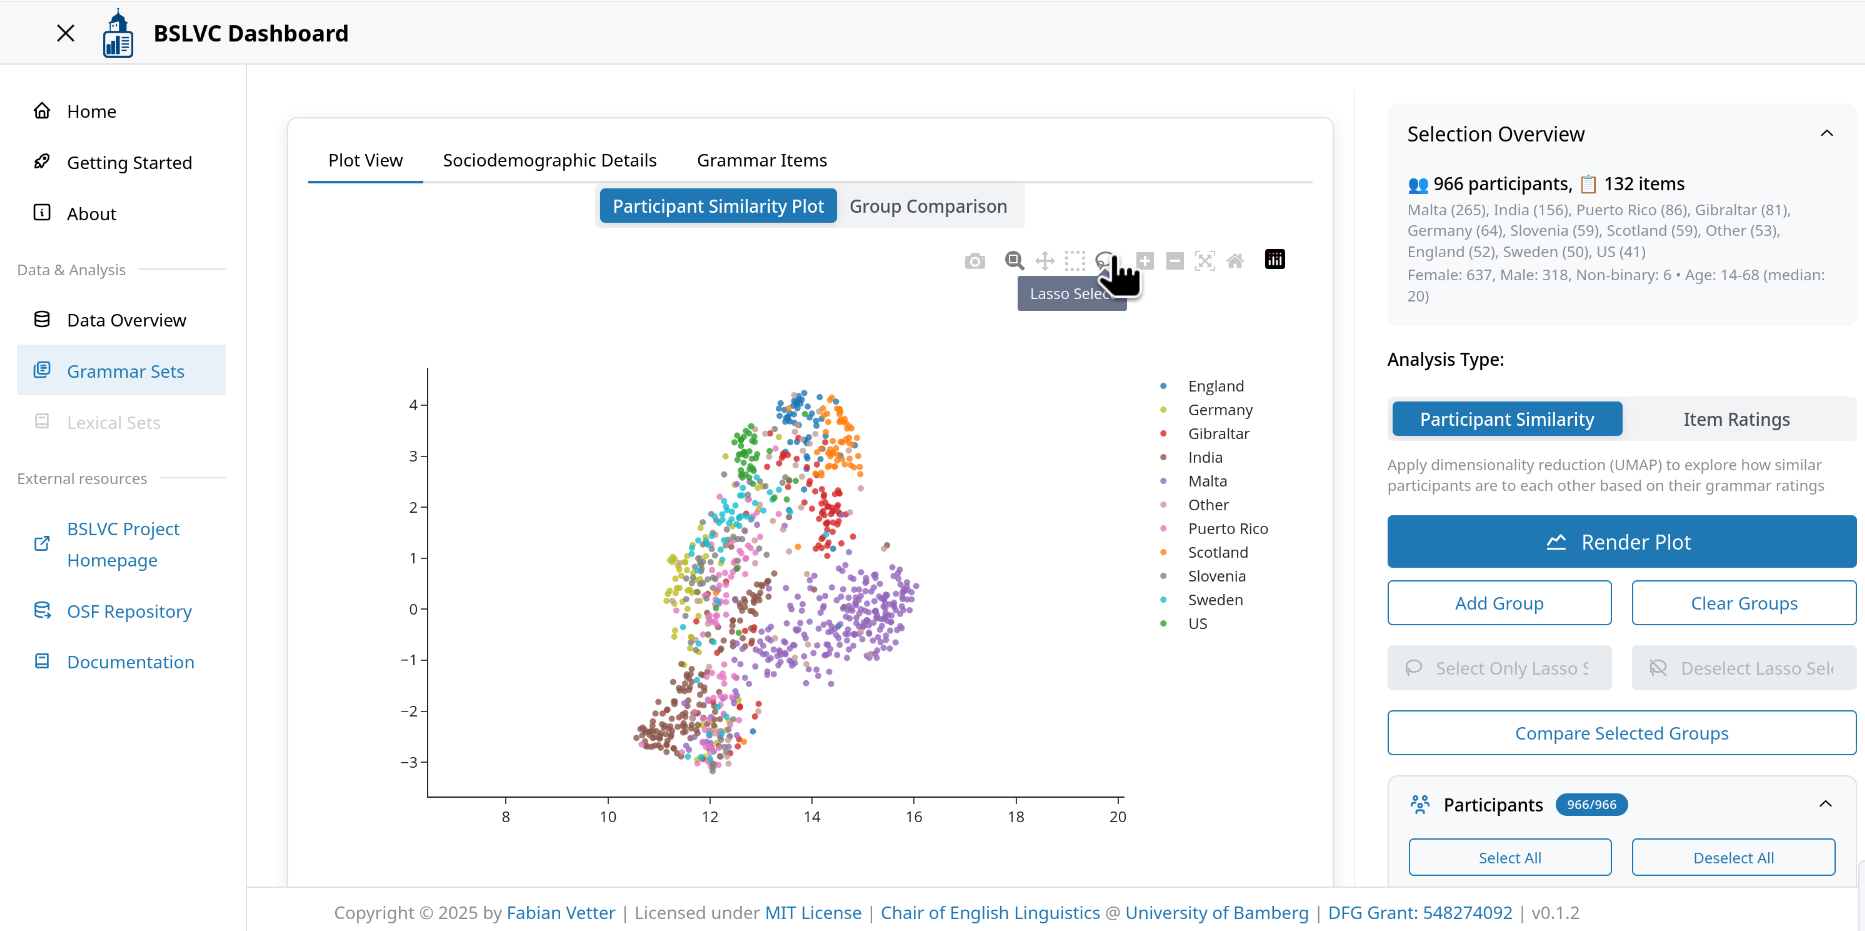
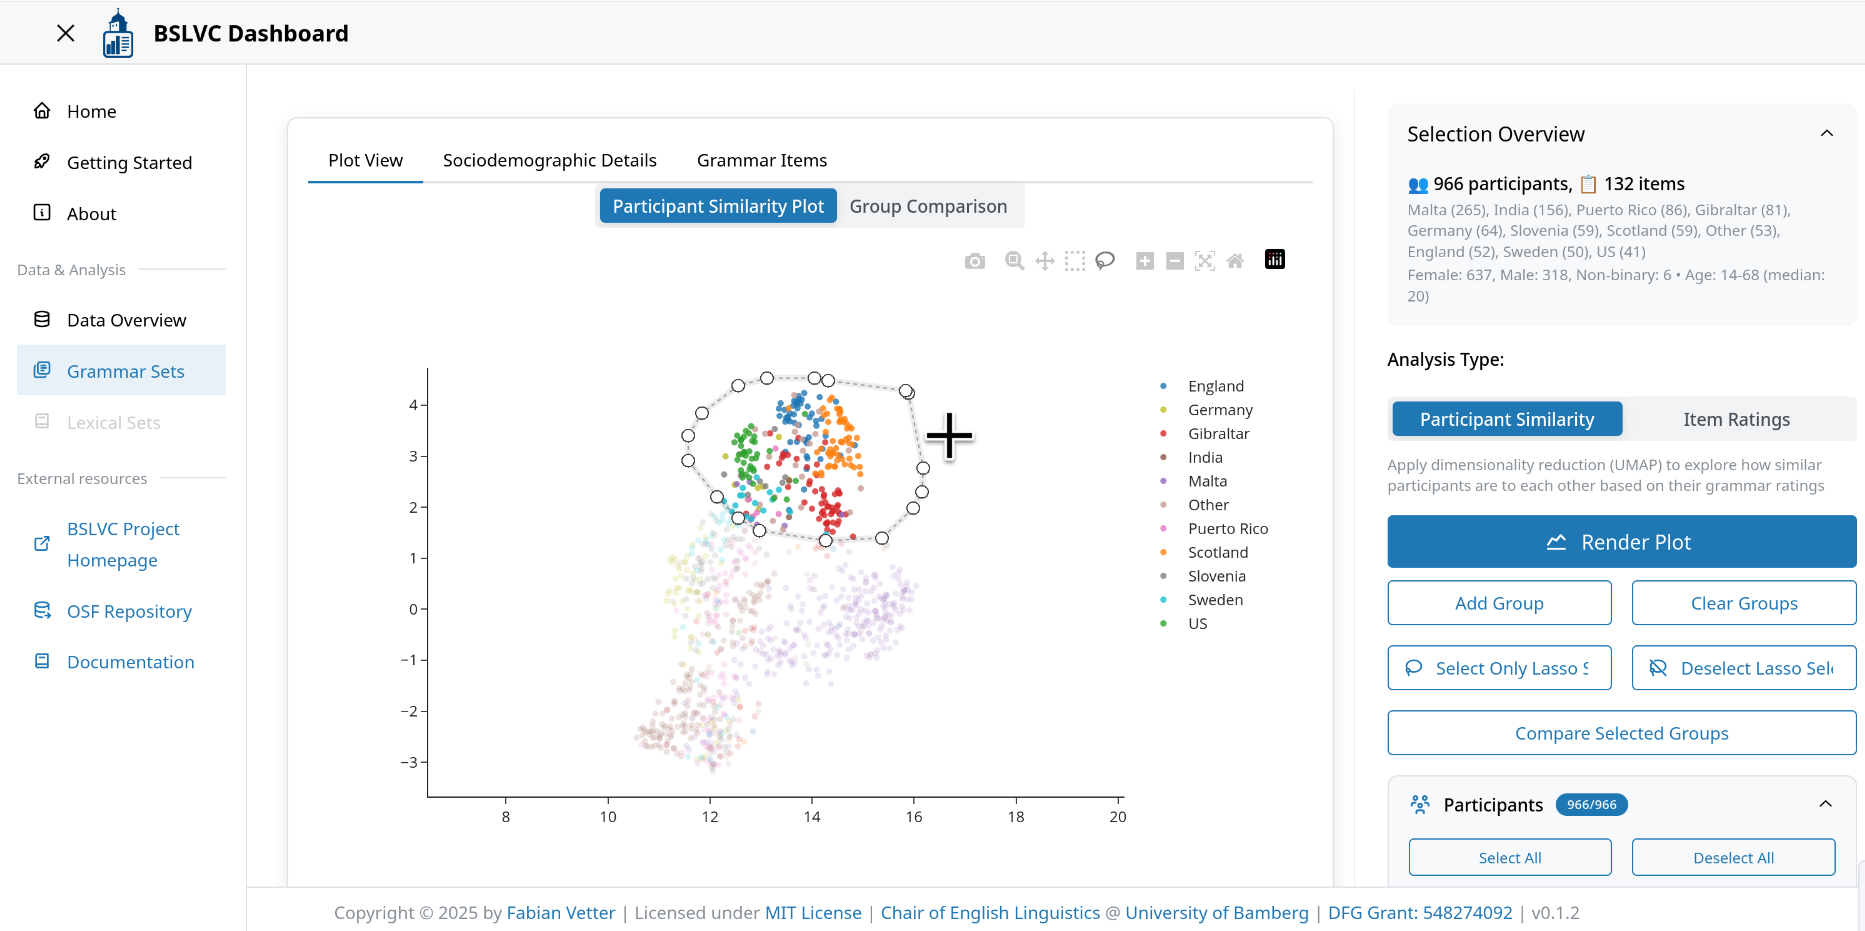
- Click "Add Group" to save the selected participants as a group
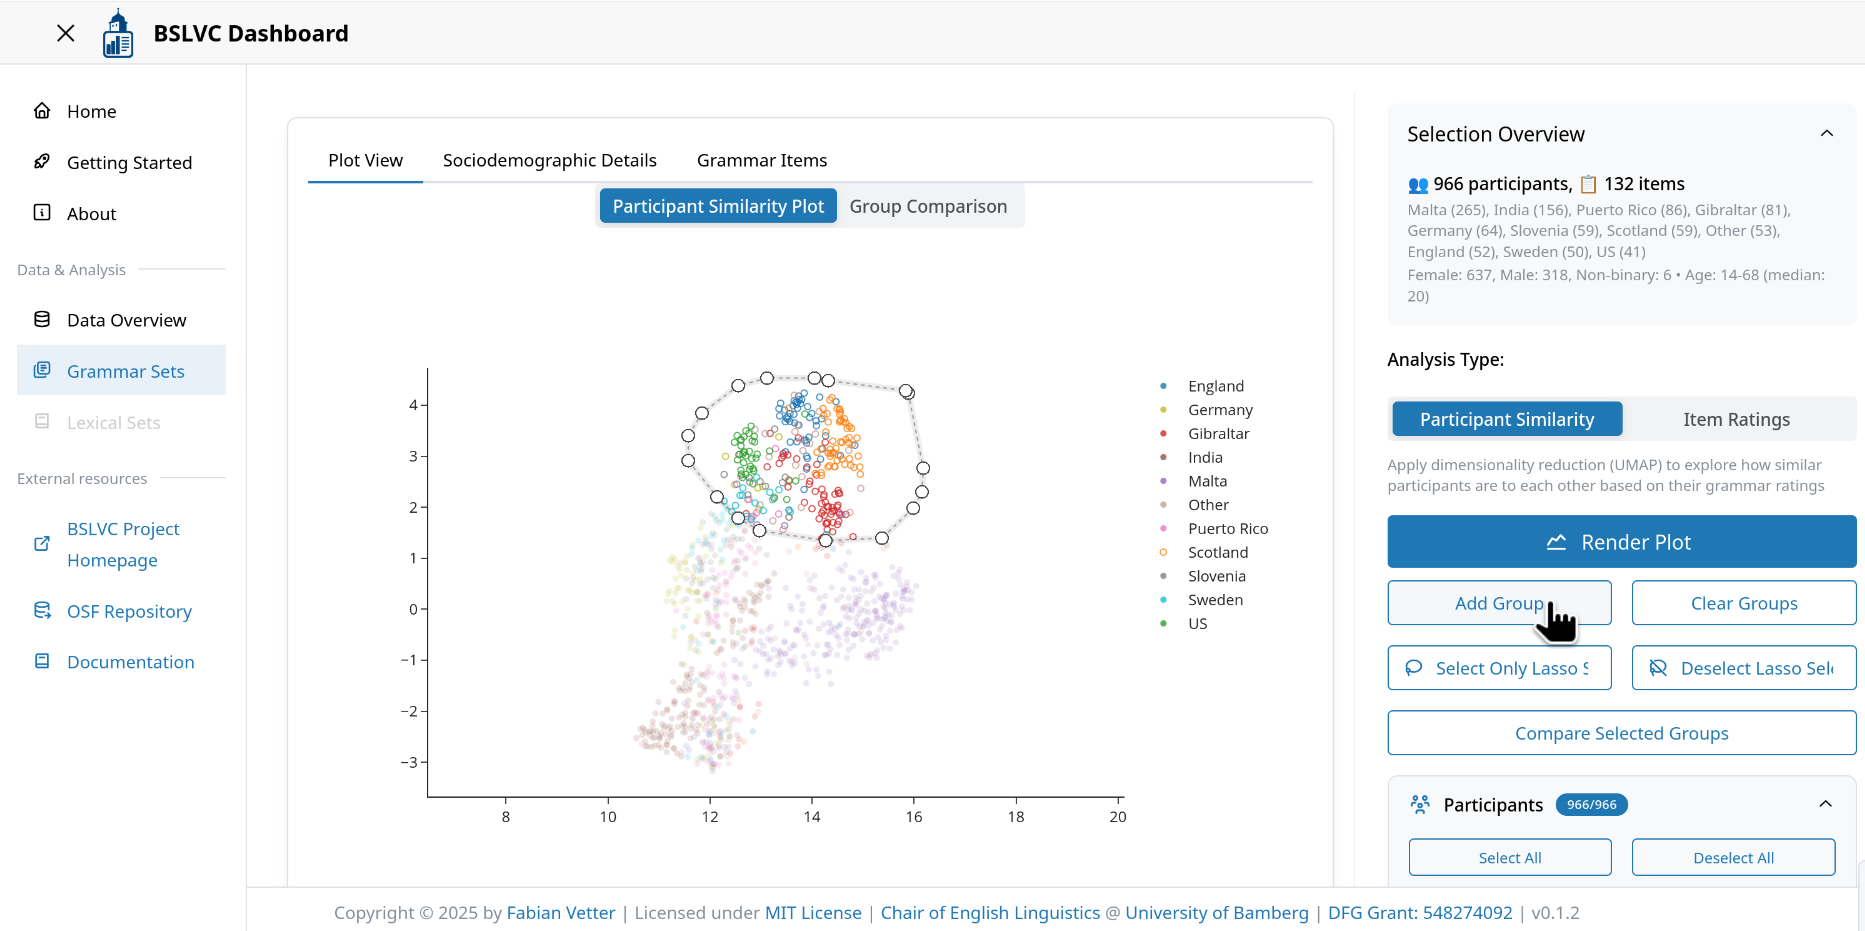
- Repeat steps 2-3 to add additional groups (if desired)
- Click "Compare Selected Groups" to generate a group comparison (Kruskal-Wallis ε² by default, or Random Forest if selected in the ordering method control)
Important notes:
- Custom groups override the default variety-based grouping
- The Random Forest comparison uses the same settings (participants, items, imputation) as the UMAP plot
- Use "Clear Groups" to reset and return to variety-based grouping
- The "Deselect Lasso Selection" and "Select Only Lasso Selection" buttons can be used to refine your participant selection by excluding outliers visible in the UMAP plot
Flagged Items
Some grammar items have been flagged due to various issues that may affect analysis results:
Currency/Unit Items: - 'M19', 'J23', 'C21', 'C14', 'A4': These items involve currency or unit measurements that may vary by region. An overview which item was used in which version of the questionnaire can be found in the BSLVC resources repo (https://github.com/vetterf/bslvc-resources; coming soon).
Rendering Issues: - 'E22', 'D12', 'E6', 'M23': These items have different renderings in some varieties:
E22: This is exactly that I wanted. Our Swedish speaker autocorrected this item to This is exactly what I wanted, effectively turning this into a control item. All other varieties are unaffected.
D12: I'll tell Jane when I meets her. Our Scottish and Swedish speaker aspirates the ts in meets heavily, thus somewhat blurring the line between the standard use when I meet her and the non-standard when I meets her.
E6: I'm learning French, because is a beautiful language. Again the rendering by our Scottish speaker blurs the line between non-standard is and it's.
M23: They are desperately looking for people able to translate the Maltese text in English. In some questionnaires the end of the sentence was cut off or a superfluous their was introduced before English.
L16: The country must better integrate into the EU. In most older questionnaires (pre 2019), this item reads That country [...]. It appears that the newer the-rendering results in slightly higher ratings. All newer (post 2019) questionnaires use The [...].
The "Flagged" button in the Grammar Item Selection section automatically deselects these items. Users should be aware of these issues when interpreting results that include these items.
Lexicon Analysis Module
The Lexicon Analysis Module is currently under development. This module will provide tools for exploring lexical variation across English varieties.
Imputed vs. Raw Data Usage
The dashboard provides both imputed and raw (unimputed) data. The "Use imputed data" switch in the Grammar Item Selection controls which version is used. The switch defaults to off (raw data). Below is a summary of how each component handles missing data:
| Component | Data used | Reason |
|---|---|---|
| UMAP (Participant Similarity) | Always imputed | UMAP cannot handle missing values. The switch is automatically forced on and disabled when in this mode. |
| Group Comparison (Kruskal-Wallis ε²) | Always imputed | The Kruskal-Wallis test requires complete cases per item; imputed data ensures no rows are dropped. |
| Group Comparison (Random Forest model) | Always imputed | scikit-learn's RandomForestClassifier cannot handle NaN values. If input contains missing values, rows are dropped before training. |
| Group Comparison (table means) | Respects user switch | The per-group mean ratings and counts shown in the top features table use whichever data source the switch is set to. |
| Item Ratings plots | Respects user switch | Works with both raw and imputed data. Raw data is the default. |
| Data Export | Respects user switch | Exports whichever version the switch is set to. |
| Distance Matrix Export | Always imputed | Uses the same data as the UMAP plot. |
When the user's switch is set to "off" (raw data) but a function requires imputed data, the dashboard displays a note informing the user that imputed data is being used.
Data Imputation
The BSLVC data contain missing values. Imputation is performed in the data-pipeline repository using the missForest algorithm, an iterative random forest-based imputation method. The algorithm iteratively imputes missing values by training a random forest on observed values and predicting the missing ones. For each sample with missing data, the MainVariety (participant's primary language variety) is included as a predictor alongside other grammar items, allowing the algorithm to learn variety-specific patterns and improve imputation accuracy. The imputed data are stored in the SQLite database alongside the raw data. Users can toggle between them via the "Use imputed data" switch (see Imputed vs. Raw Data Usage).
Before imputation, participants with more than 50 missing grammar items or 25 missing lexical items are dropped.
Caching System
The BSLVC Dashboard implements a multi-layered caching strategy to optimize performance and reduce computation time for expensive operations. The caching system consists of three levels: server-side disk cache, in-memory Python cache, and browser-side storage.
Server-Side Disk Cache
The dashboard uses DiskCache (via the diskcache library) for persistent storage of computationally expensive plot objects.
UMAP Plot Caching
UMAP (Uniform Manifold Approximation and Projection) computations are expensive and are cached based on input parameters:
Cache Key Components: - Participant list (sorted) - Item list (sorted) - UMAP hyperparameters (n_neighbours, min_dist, distance_metric) - Standardization flag - DensMAP flag - Pairs mode flag - Regional mapping flag
Cache keys are hashed using MD5 to create unique identifiers.
Random Forest Plot Caching
Random Forest comparison plots are also cached.
Cache Invalidation: - Disk cache persists between sessions - Cache is stored indefinitely (no expiration) - Manual cache clearing requires deleting the cache directory
In-Memory Python Cache (LRU)
The dashboard uses Python's functools.lru_cache decorator for in-memory caching of frequently accessed data.
LRU (Least Recently Used) cache automatically evicts the least recently accessed items when the cache is full.
Browser-Side Storage (Dash dcc.Store)
The dashboard leverages Dash's dcc.Store component for client-side data persistence with three storage types:
Memory Storage
Temporary storage cleared when page is refreshed:
dcc.Store(id="UMAPgroup", storage_type="memory", data=0)
dcc.Store(id="UMAPparticipants", storage_type="memory", data=[])
dcc.Store(id="UMAPitems", storage_type="memory", data=[])
dcc.Store(id="UMAPGroupsForRF", storage_type="memory", data={"dataframe": ...})
dcc.Store(id="grammar_plots_UMAP", storage_type="memory", data=None)
dcc.Store(id="grammar_plots_item", storage_type="memory", data=...)
dcc.Store(id="leiden-cluster-data", storage_type="memory")
dcc.Store(id="umap-hoverinfo-store", storage_type="memory")
dcc.Store(id="umap-render-trigger", storage_type="memory")
dcc.Store(id="umap-render-settings", storage_type="memory")
dcc.Store(id="clipboard-settings-store", storage_type="memory")
Use Cases: - Current UMAP group selections - Active participant/item selections - Plot data for current session - Clustering results - Temporary UI state
Session Storage
Persists across page refreshes within the same browser tab/window:
dcc.Store(id="last-rendered-item-plot", storage_type="session")
dcc.Store(id="last-rendered-umap-plot", storage_type="session")
dcc.Store(id="last-sociodemographic-settings", storage_type="session")
Use Cases: - Last rendered plots (survive page refresh) - Sociodemographic plot settings - Session-specific cache
Local Storage
Persists across browser sessions (stored in browser's localStorage):
dcc.Store(id="saved-item-settings", storage_type="local")
dcc.Store(id="saved-umap-settings", storage_type="local")
Use Cases: - User-saved settings - Persistent user preferences - Long-term storage across sessions
How Caching Layers Work Together: UMAP Plot Rendering
When a user requests a UMAP plot, the three caching layers work in concert to minimize computation time. Here's the complete workflow:
Step 1: User Interaction
User selects participants, items, and UMAP settings (neighbors, distance metric, etc.), then clicks "Render Plot".
Step 2: Data Retrieval (LRU Cache)
LRU Cache Role:
- get_grammar_data_cached() checks if full grammar dataset is already in memory
- If cache hit: Returns data from memory
- If cache miss: Queries SQLite database, stores result in LRU cache
- Subsequent requests with same regional_mapping parameter use cached data
Step 3: UMAP Computation (DiskCache)
DiskCache Role: - Checks if this exact combination of parameters was computed before - If cache hit: Loads pre-computed plot from disk - If cache miss: Computes UMAP, saves to disk - Cache persists across application restarts
Why cache UMAP plots? - UMAP computation is extremely expensive (5-30 seconds) - Plot objects are large (serialized Plotly figures with all trace data) - Many possible parameter combinations (participants × items × settings) - Results are deterministic - same inputs always produce same plot - Persistence across sessions is valuable (users often revisit the same views)
Step 4: Browser Storage (dcc.Store)
Browser Storage Role: - Stores the most recent UMAP plot data in browser's sessionStorage - When user switches between "Participant Similarity" and "Item Ratings" views, the last rendered plot is restored instantly - Survives page refreshes within the same browser session
Why Browser Storage? - Instant restoration when switching plot types - No server round-trip or re-rendering needed - Session-specific (different tabs maintain independent state)
Important Note: This only restores plots when switching between plot types in the same session, not when switching browser tabs or windows. The plot must be re-rendered if the page is refreshed or the application is reopened.
Last Updated: February 2026
Version: 0.1.5